
TV accessibility: insights from research
This year I presented at CSUN for the first time. For those unfamiliar, CSUN is one of the largest accessibility conferences in the world, bringing together practitioners, researchers and advocates working on accessibility.
I presented findings from two years of research into TV accessibility for people with sight loss. This article covers the main findings from that work.
The research
At the BBC, we had unanswered questions about how people with sight conditions experience TV:
- Which devices do they use?
- What features matter most?
- What assistive technologies and settings do they rely on?
- How well do TV screen readers support HTML accessibility features?
To find out, we used a mixed-methods approach:
- A survey reaching 1,172 people with visual impairments across the UK
- Interviews and usability testing to understand people's experiences in more depth
- Technical research to assess HTML support in TV screen readers
The survey ran through three channels, each reaching a different part of the audience: a YouGov panel of 1,015 people, mostly aged 55 and over; 100 people recruited through People for Research (PFR), across a range of visual impairment severities; and 57 people through RNIB, which had the highest proportion of screen reader users.
Device use differs across the samples
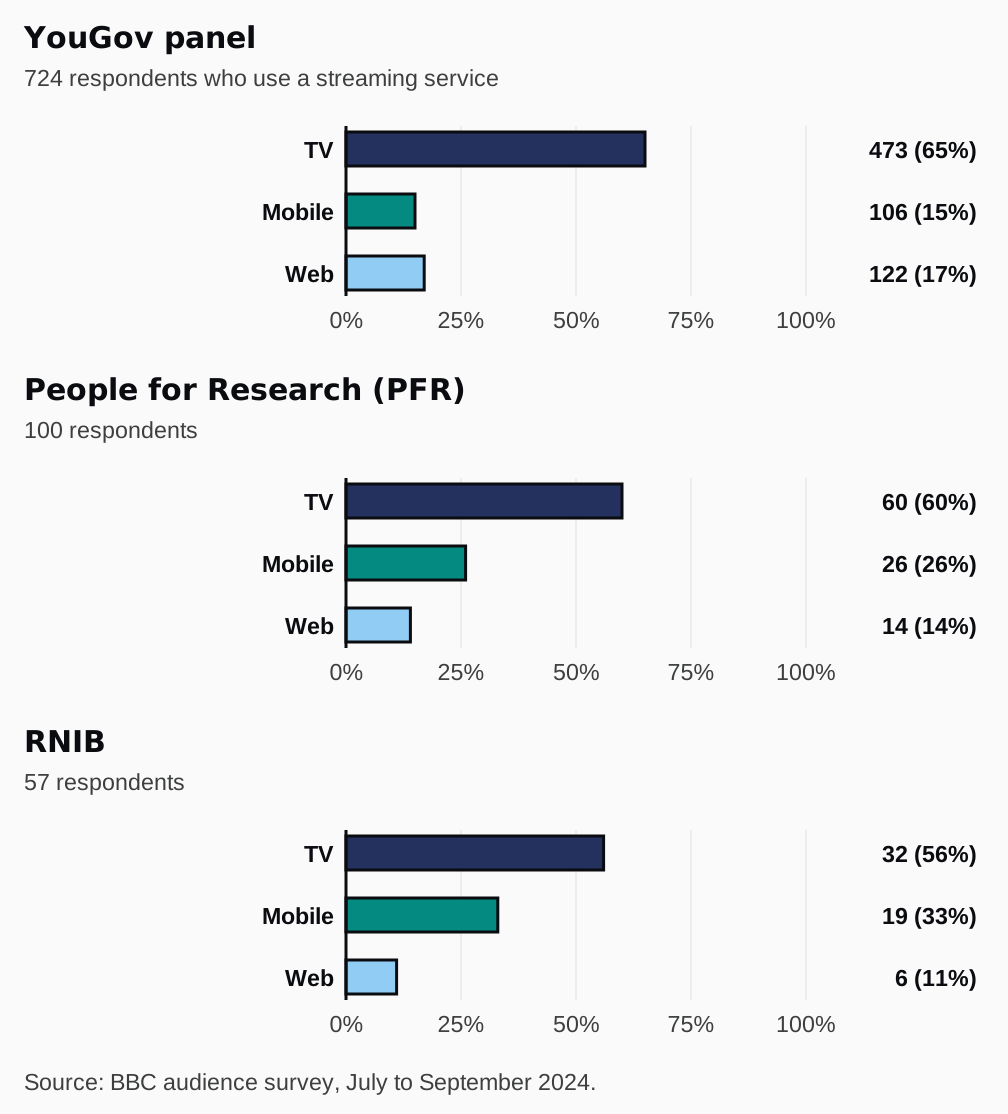
TV was the most-used platform in all three samples, but mobile use differed considerably between them.
Which device do you use the most to access streaming services?
Chart
Data
| Platform | YouGov | PFR | RNIB |
|---|---|---|---|
| TV | 473 (65%) | 60 (60%) | 32 (56%) |
| Mobile | 106 (15%) | 26 (26%) | 19 (33%) |
| Web | 122 (17%) | 14 (14%) | 6 (11%) |
Most-used device for streaming. YouGov n=724 (respondents who use a streaming service); PFR n=100; RNIB n=57. TV includes smart TVs, streaming devices and set-top boxes; mobile includes phones and tablets; web includes PCs and laptops. YouGov gaming console and "don't know" responses (23 in total) are not shown. PFR and RNIB are small samples, so read their percentages as a guide to the counts rather than as population estimates.
In the YouGov sample, 65% watch mainly on a TV platform and 15% on a mobile or tablet. In the PFR sample, mobile rises to 26%. In the RNIB sample, a third watch mainly on mobile. Among PFR respondents who are blind or have profound sight loss, 61% mainly use mobile (11 of 18 people).
These are different populations, so the survey can't show people moving from one platform to another. One possible explanation is that people who rely more heavily on assistive technology choose devices where that technology works better. When we asked why people chose their device, the answers pointed to different factors:
"Apple iPhones have VoiceOver which I have found easiest ever for accessing all formats."
"They have a large screen."
"I need help from another person with sight to watch Now TV and Netflix on my tv. Otherwise I use my mobile phone."
This matters because television is often watched with other people. Where someone cannot independently use the living-room TV with their assistive technology, they may end up watching on a phone instead.
Accessibility affects service choice
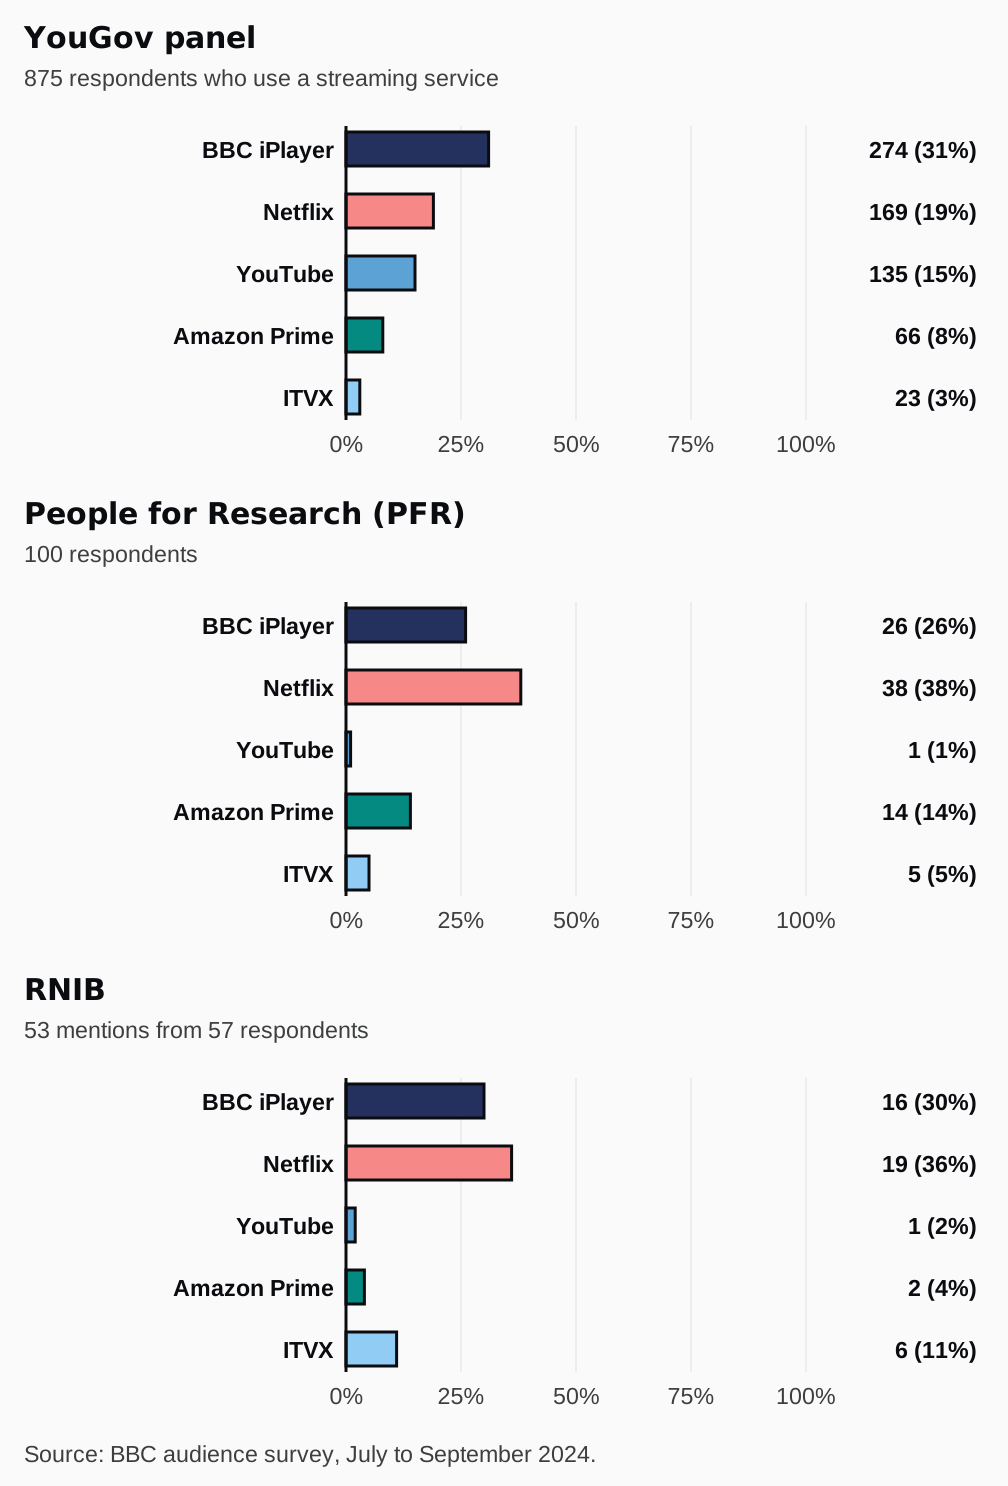
All three samples were asked which streaming service they find most accessible. iPlayer led in the YouGov sample (31%). In PFR and RNIB, the two samples with more screen reader users, the ranking reversed and Netflix led (38% and 36%).
Which streaming service do you find the most accessible?
Chart
Data
| Service | YouGov | PFR | RNIB |
|---|---|---|---|
| BBC iPlayer | 274 (31%) | 26 (26%) | 16 (30%) |
| Netflix | 169 (19%) | 38 (38%) | 19 (36%) |
| YouTube | 135 (15%) | 1 (1%) | 1 (2%) |
| Amazon Prime | 66 (8%) | 14 (14%) | 2 (4%) |
| ITVX | 23 (3%) | 5 (5%) | 6 (11%) |
Streaming service named most accessible. YouGov n=875 (respondents who use a streaming service); PFR n=100. The RNIB question was free text, so its figures are mentions rather than respondents (53 mentions from 57 people; four named more than one service, nine named no service or said none are accessible). Smaller services and "don't know" responses are not shown, so columns don't sum to their bases.
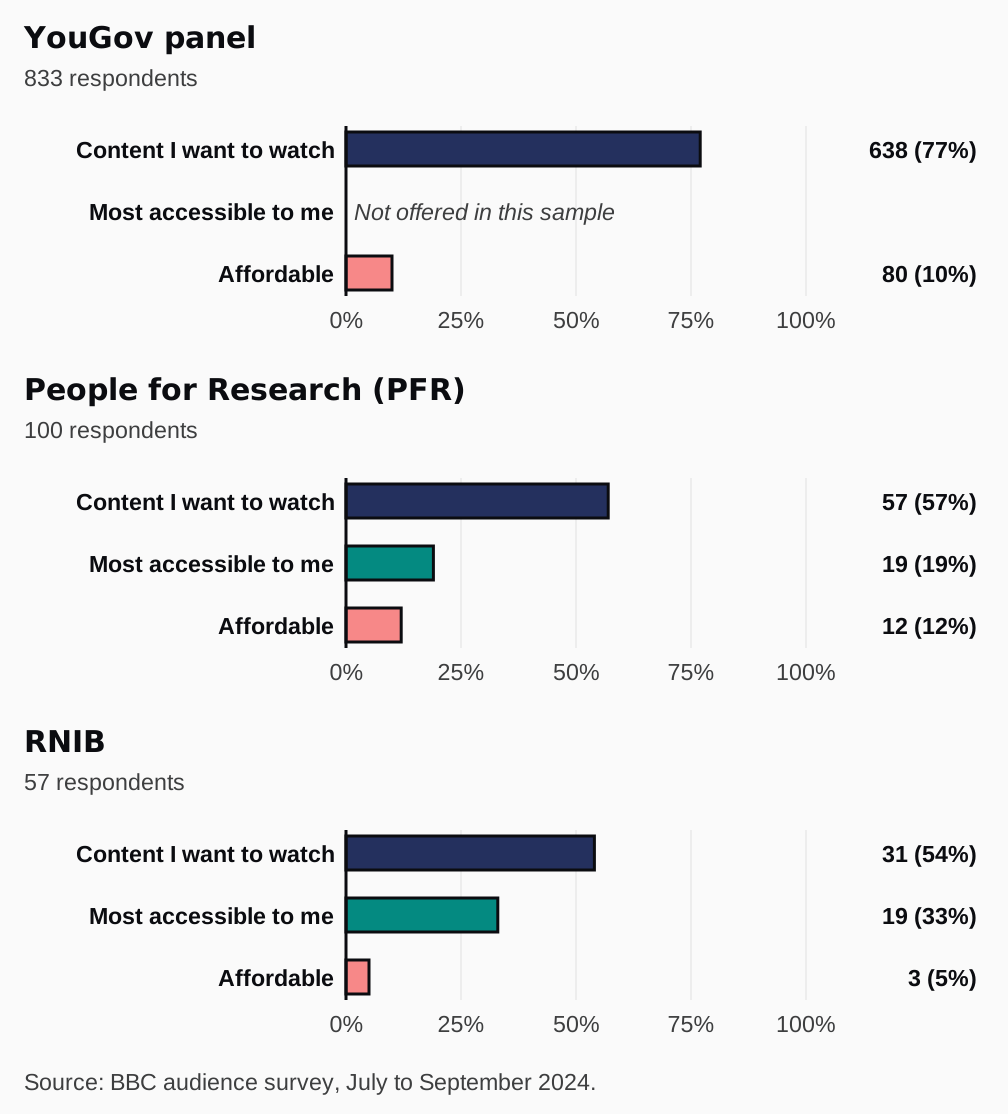
But naming a service as accessible is not the same as using it. When we asked why people chose the service they use most, content came first in every sample:
Why did you choose this streaming service?
Chart
Data
| Reason | YouGov | PFR | RNIB |
|---|---|---|---|
| Content I want to watch | 638 (77%) | 57 (57%) | 31 (54%) |
| Most accessible to me | Not offered | 19 (19%) | 19 (33%) |
| Affordable | 80 (10%) | 12 (12%) | 3 (5%) |
Main reason for choosing the streaming service used most. YouGov n=833; PFR n=100; RNIB n=57. The YouGov version of this question didn't offer accessibility as an option. Smaller categories ("other", family or multi-user, "don't know") are not shown, so columns don't sum to their bases.
Where accessibility was offered as an answer, it was chosen by 19% of the PFR sample and 33% of the RNIB sample.
The PFR and RNIB surveys also let us compare the service people named most accessible with the one they actually use. Among respondents who chose their service mainly for its content, more than a third in PFR and two thirds in RNIB do not use the service they named most accessible. Among those who chose mainly for accessibility, 17 of 19 in PFR and 14 of 19 in RNIB do.
Many respondents use a service they consider less accessible because it has the content they want. Choosing a more accessible service may mean giving up that content.
What people value
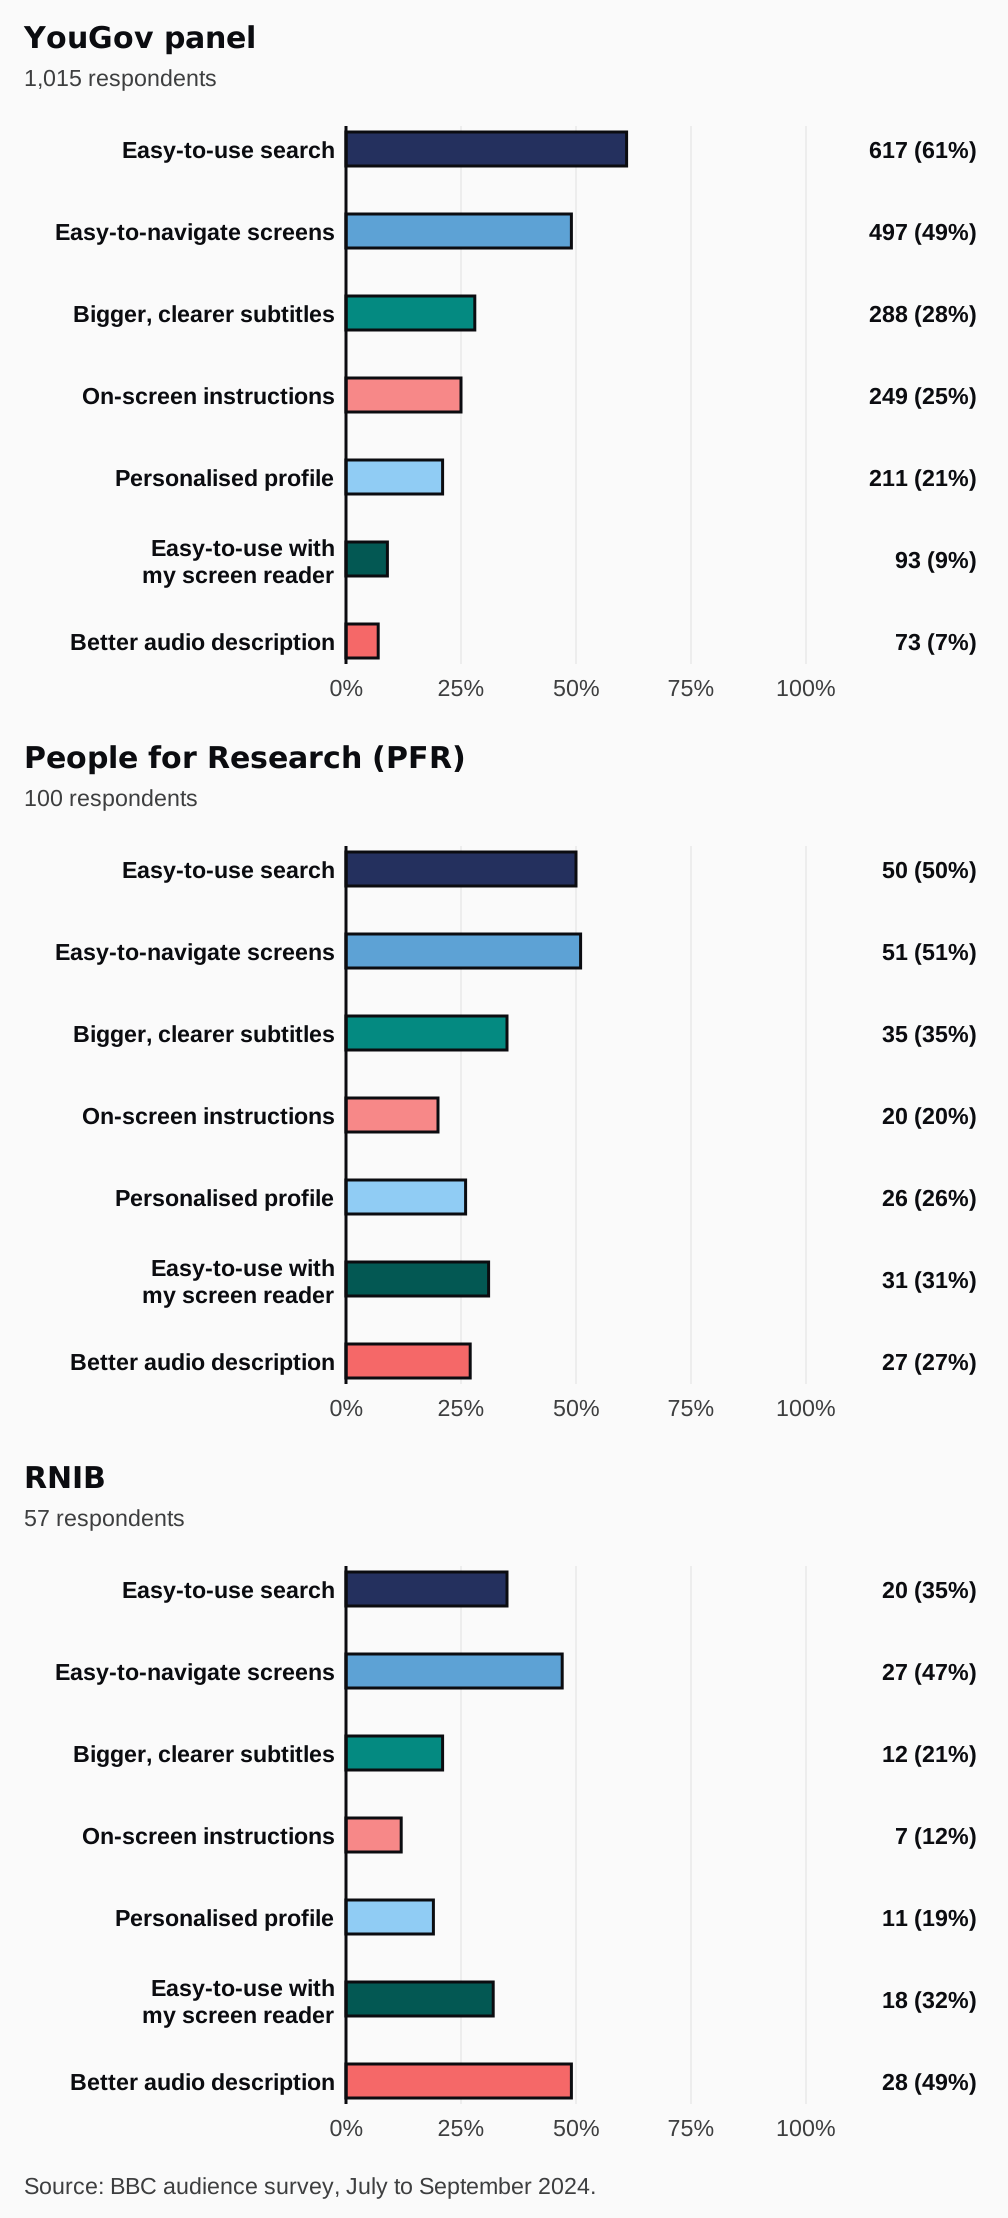
Easy search and easier navigation were among the most commonly selected features across all three samples.
What features do you care about the most in a streaming service?
Chart
Data
| Feature | YouGov | PFR | RNIB |
|---|---|---|---|
| Easy-to-use search | 617 (61%) | 50 (50%) | 20 (35%) |
| Easier navigation | 497 (49%) | 51 (51%) | 27 (47%) |
| Bigger, clearer subtitles | 288 (28%) | 35 (35%) | 12 (21%) |
| On-screen guidance | 249 (25%) | 20 (20%) | 7 (12%) |
| Personalised profile | 211 (21%) | 26 (26%) | 11 (19%) |
| Screen reader compatibility | 93 (9%) | 31 (31%) | 18 (32%) |
| Audio description | 73 (7%) | 27 (27%) | 28 (49%) |
Accessibility features people care most about in a streaming service. Multi-select, so columns don't sum to their bases. YouGov n=1,015; PFR n=100; RNIB n=57. The most-selected options are shown; a few smaller ones are omitted.
The biggest differences were in more specialist accessibility features. Screen reader compatibility rises from 9% in the YouGov sample to around a third in PFR and RNIB. Audio description rises from 7% in YouGov to 27% in PFR and 49% in RNIB, where it was the most commonly selected feature.
The gradient tracks the samples: screen reader use is 6% in YouGov, 36% in PFR and 46% in RNIB, and the YouGov panel is much older, with 83% aged 55 or over.
Search and navigation remain important across all three samples, alongside more specialist features such as screen reader compatibility and audio description.
Navigation remains a common frustration
Participants described problems finding and navigating content:
"Navigation issues when trying to find content or searching."
"Complicated and unintuitive menu navigation."
"Frequent UI changes causing confusion."
For screen reader users in particular, familiarity can help them understand and navigate an interface when other structural cues are limited.
Personalisation, and watching together
Personalisation was a recurring theme in the research. Being able to customise settings, or having a service remember your preferences, takes friction out of streaming: in the survey, personalised profiles were valued by around a fifth to a quarter of each sample. When a service adapts to you, there is less to set up before you can watch.
But personalisation is framed around one person, and television is often shared. Not everyone in a household has the same accessibility needs.
Carrie watches TV with a family whose access needs all differ. She took part in research through a collaboration with Fable, who have kindly allowed me to share this clip.
In Carrie's house, audio description and closed captions run at the same time, and the TV works for everyone because the features stack. Not every service allows that, and not every mix of needs resolves so happily.
Accessibility features can conflict during shared viewing
Television is often a shared experience, but accessibility settings do not always accommodate the needs of everyone watching together.
We heard from a couple where one partner uses audio description and the other is sighted. Audio description helped them both learn character names:
"Helps us both with learning, identifying, and recalling characters in a new show more easily."
But it could also disrupt scenes where music mattered:
"When music plays a key role in setting the tone of a scene, we find that AD can take away from that epic, soaring musical score. For instance, Lord of the Rings AD won't shut up about describing a battlefield, when all I want is to soak in that soaring, orchestral score."
Another participant described a conflict between two people's access needs:
"It isn't possible to watch a programme with both audio description and subtitles meaning we have to choose between accessibility for me and my autistic son."
We also heard that audio description volume can be difficult to manage:
"Audio description is insanely loud and bassy. Being able to control description volume would be great, being able to access description on a personal device to be able to watch with family without them having to hear it would be even better."
Using a separate personal device may solve one problem while making shared viewing more difficult.
People may need audio description, subtitles and different audio settings at the same time, particularly when watching with other people.
What I observed in usability testing
Usability testing showed how little context some TV screen readers provide.
One participant tried to sign in to a streaming service on her Smart TV.
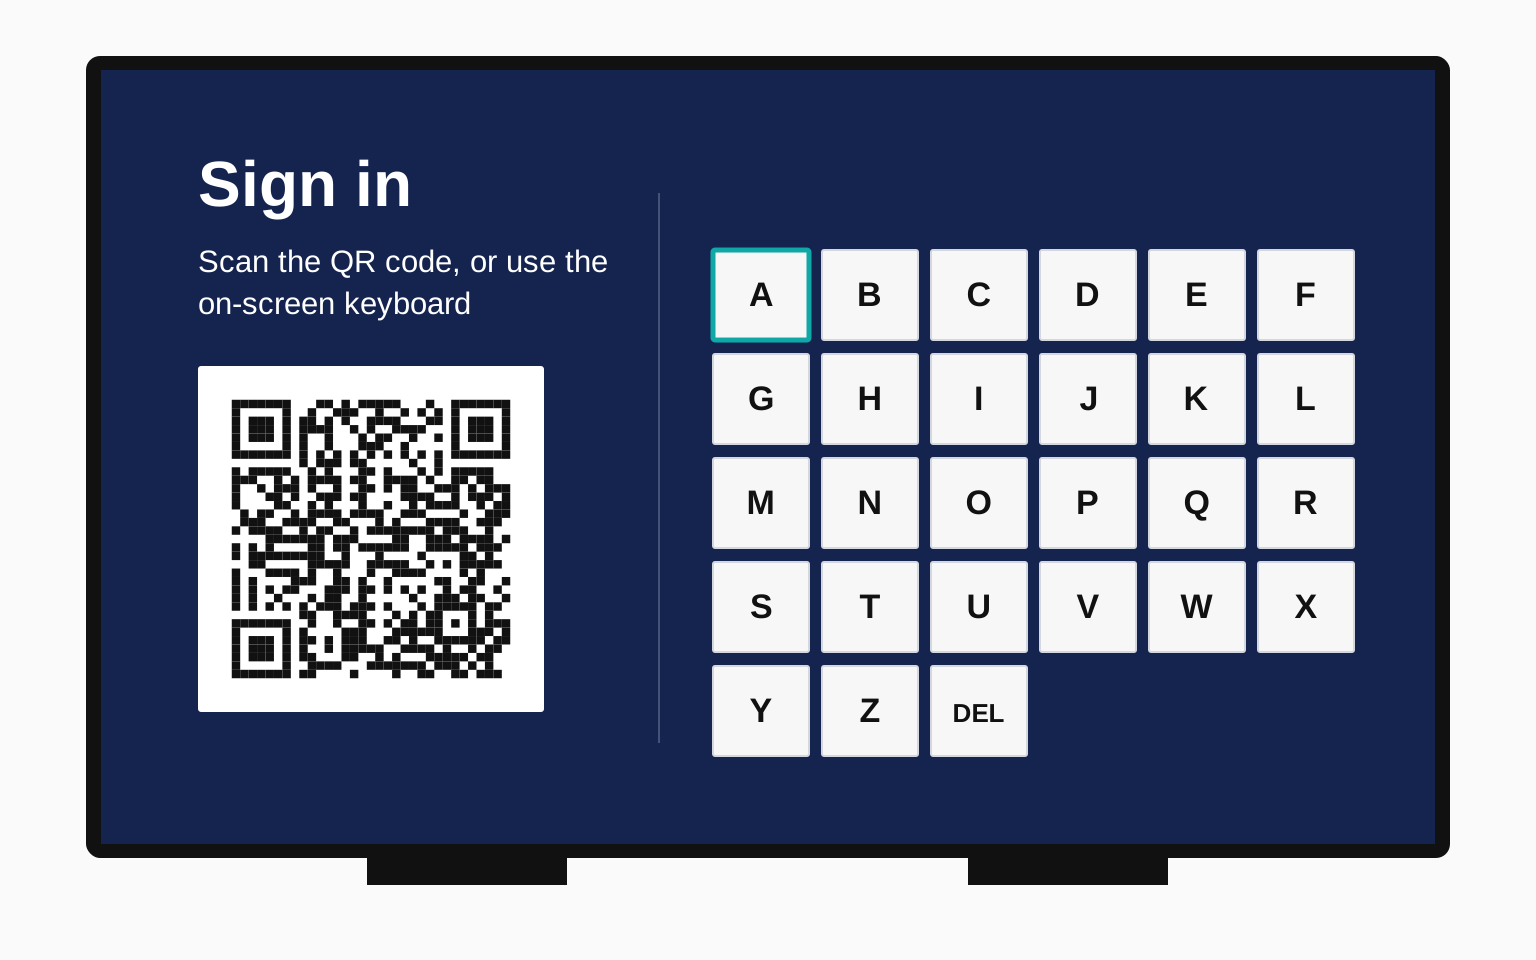
She selected "sign in" and landed on an on-screen keyboard, but had no idea where.
The screen reader announced "A, button" with nothing about:
- The page structure
- What she was supposed to do
The keyboard wasn't QWERTY but alphabetical, a layout she'd never encountered. Finding the delete key took a full minute of exploration.
She lacked trust in the screen reader and needed sighted assistance to complete the task.
For screen reader users, navigation depends not only on the interface itself but on whether the assistive technology provides enough information to understand where they are, what is available and what they can do next.
Not all TV screen readers behave the same
To understand how well TV screen readers perform, we built on research from Which? and RNIB, who developed an accessibility test to evaluate TVs for blind and partially sighted users.
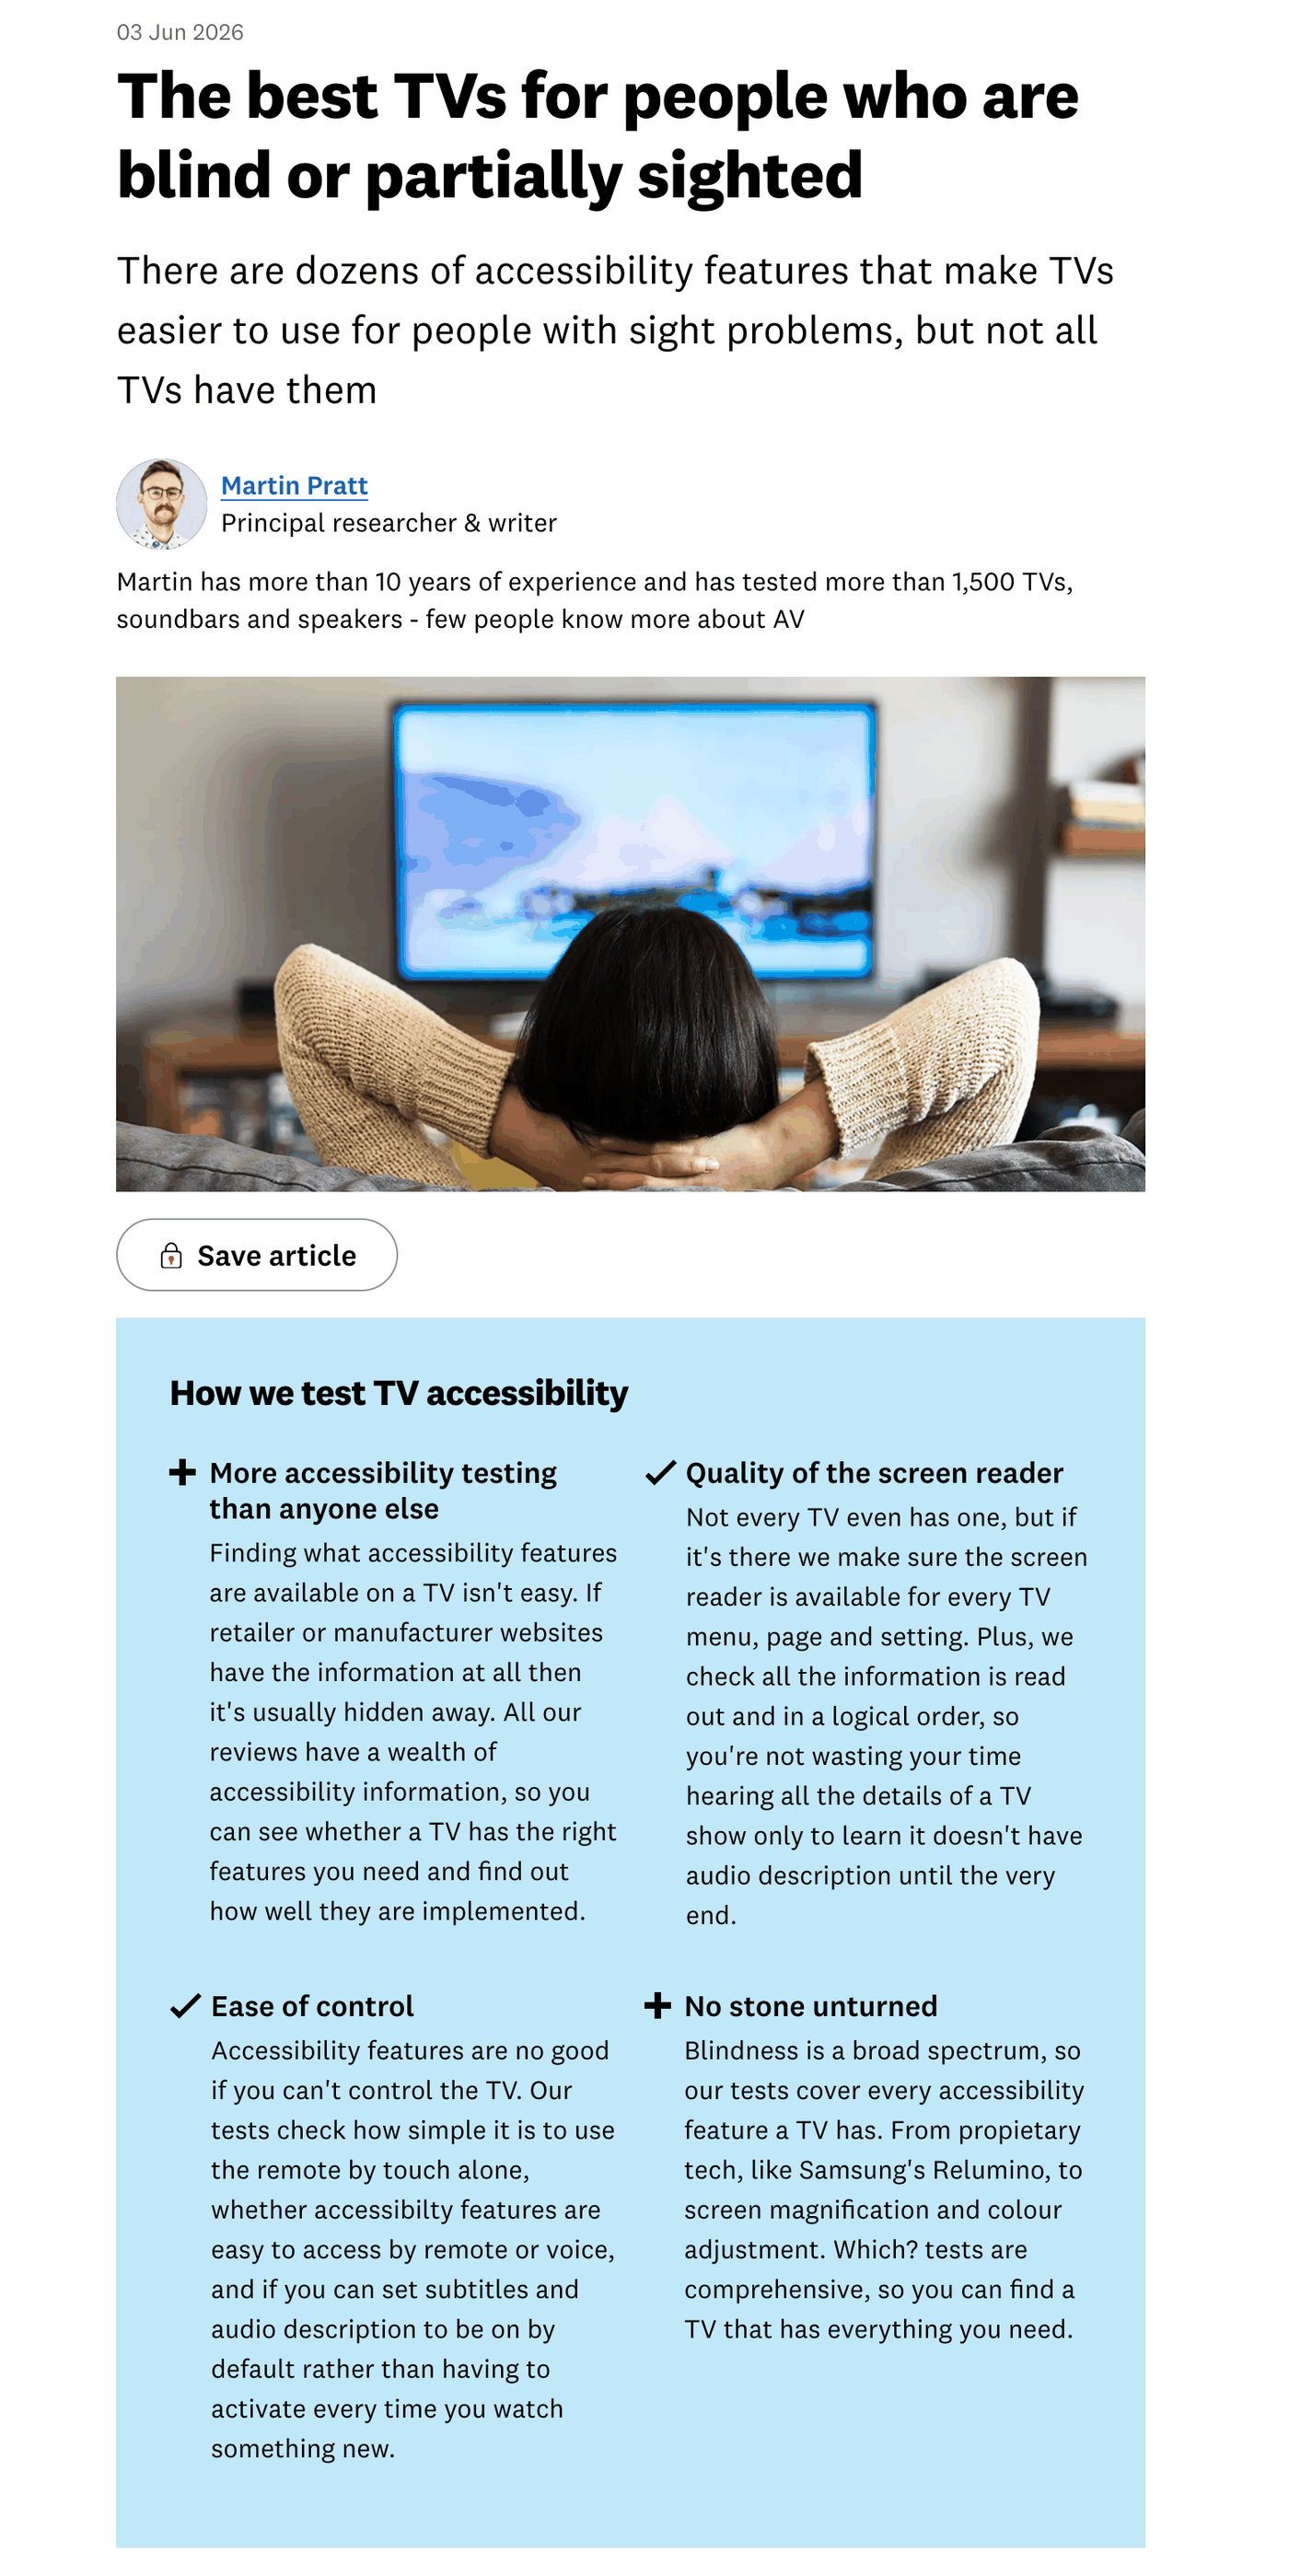
Their work gave us a starting point. We selected the top-rated TVs from their research and tested what HTML elements are actually supported by their screen readers. We also tested popular streaming devices to compare across platforms.
The TV screen readers we tested behaved very differently. Some offer settings for verbosity, speed and volume. Others don't. Some read all content, while others only navigate between focusable elements such as buttons or links.
We found significant differences:
- Some announce lists, while others don't, which can make structure and context unclear
- None of the screen readers we tested announced landmark regions like
navormain, limiting navigation and contextual cues - Heading support varies: some announce headings, some support navigation by heading, and some do neither
In one usability study, a screen reader failed to announce content on two critical screens entirely. Users had no idea what was on screen and couldn't re-read the information. The same screens worked with other screen readers.
Testing with one TV screen reader gives limited confidence about how the same experience will work on other TV platforms.
Without structural and contextual cues, navigating content-heavy TV screens can be much harder than on desktop or mobile. Even where TV browsers support particular HTML elements, the experience also depends on how the screen reader exposes and interprets them.
Voice control has limits
Voice control is often offered as an accessibility feature, but it doesn't work equally well for everyone.
"Voice control can't cope with a Scottish voice... happy to help to improve this!!!!"
As someone who lives in Scotland, I sympathise.
Poor recognition of regional accents can make voice control unreliable or unusable for some people. If voice control is someone's main way of interacting with a service, recognition accuracy becomes an accessibility issue.
What helps
The research and technical testing suggest some practical considerations:
- Announce context on arrival. When focus lands on a screen, tell users where they are and what's expected. Don't assume exploration will fill the gaps.
- Give controls meaningful names. A screen reader user needs enough information to understand the purpose of a control, not simply that it is a "button".
- Use familiar patterns. Where an on-screen keyboard is needed, consider whether a familiar layout such as QWERTY will make it easier to navigate.
- Test on real devices. TV screen readers differ, and emulators won't reveal all of these differences. Test on actual hardware with native screen readers.
What this means for TV accessibility guidance
The BBC was delivering information through television long before the internet, starting with Ceefax in the 1970s. Today, Smart TVs, streaming sticks and games consoles have transformed how people watch content.
BBC accessibility guidelines currently cover web and mobile, but not TV. We're using this research to inform accessibility guidance for TV.
The BBC already follows key design principles for TV:
- Consistency across apps
- Optimising for the remote control
- Reducing the number of presses to complete tasks
- Designing for the living room environment
Accessibility needs to be considered alongside these principles.
Web accessibility standards such as WCAG provide an important foundation, but they do not account for all of the constraints of television. Interaction models, input methods and screen reader capabilities vary considerably between TV platforms.
Our next step is to use this research, alongside technical testing, to develop accessibility guidance that reflects how people actually use television.
Television is about shared stories. Everyone deserves to reach them.